Quality Assurance
What is Quality Assurance?
Quality assurance (QA) measures the overall health of your website content. Siteimprove’s Quality Assurance module identifies old and irrelevant content, broken links, and outdated branding or wording. It also provides readability scores on every published page of your site and a detailed inventory of the pages, files, and other published assets.
Quality Assurance Dashboard
The Quality Assurance Dashboard displays reports for specific content areas:
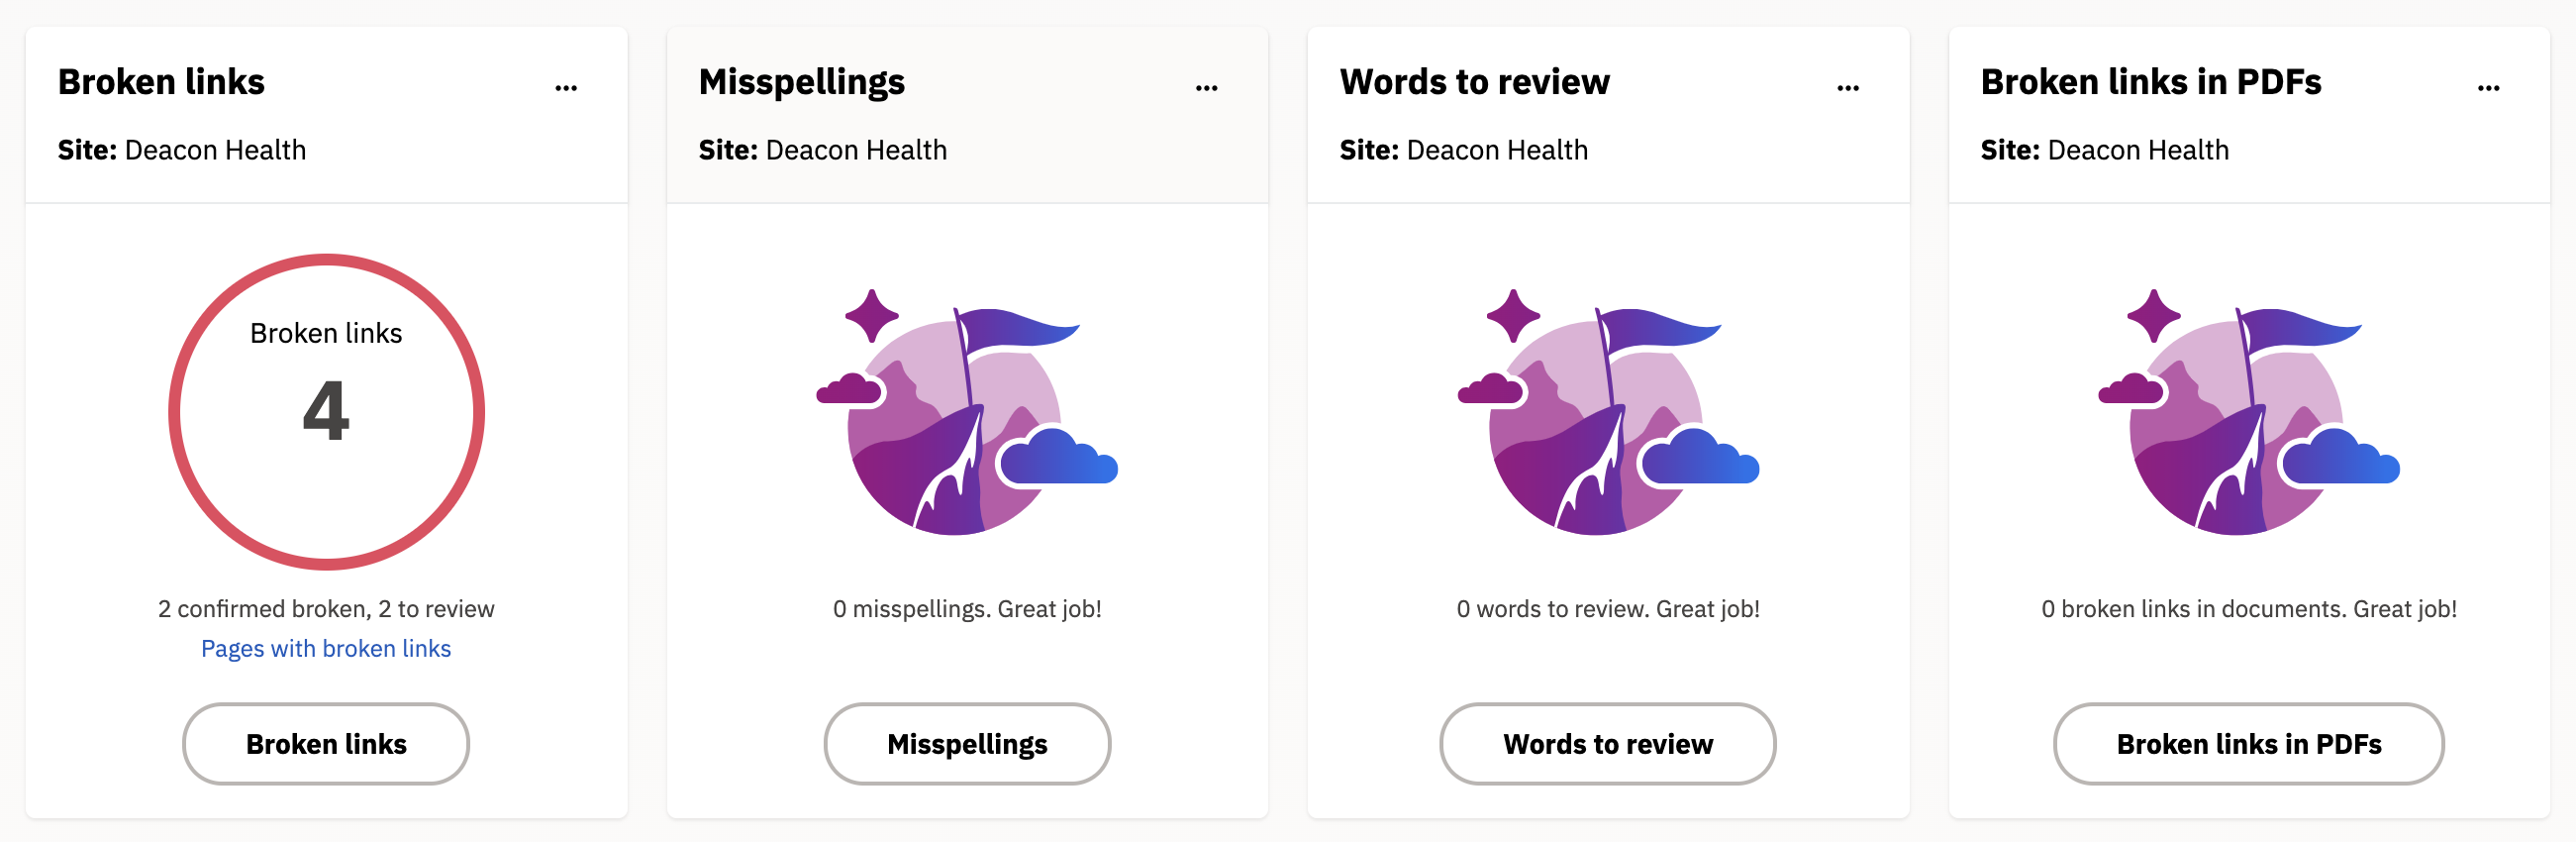
- General Issues
- Broken links
- Misspellings
- Words to review
- Broken links in PDFs
- Readability
- Accessibility
- Issues
- Site Inventory
- Content (QA)
- Personal (QA)
- Pages
- Inventory History
For any website content editor, one of the most important things is to make sure there are no errors on your site. This means that you need to make sure there are no issues with any of the categories above, and if there are, fix them as soon as possible. The Quality Assurance Dashboard is a great way to see what needs immediate attention on your site at a glance and be able to troubleshoot and fix those issues quickly.
What to start with
Always start with fixing broken links and correcting any spelling errors that appear on your site. Once you have these addressed you can work on tackling other issues that show up in your dashboard.
Setting the Quality Assurance Dashboard as your default dashboard
By default, when you log into Siteimprove this is the dashboard that should load on your account. However, if you change it at any point you may need to select it again when working on quality assurance issues. If you plan to spend the most time using Siteimprove to fix issues on your site, such as broken links and misspellings, it’s recommended that this be set as your default dashboard.
Here’s how you do it:
- Log into Siteimprove
- If the Quality Assurance Dashboard is not already set as your default dashboard, select it from the dropdown at the top of the screen.
- Once selected, this dashboard should display by default every time you log in or until you choose a different dashboard.
More information on setting dashboards can be found on the Getting Started page.
How to view detailed QA reports
As already mentioned, there are four different reports that are included in the Quality Assurance Dashboard. To begin fixing any issues, you’ll need to go deeper into a specific report or area of that report for more details.
The area of the dashboard you’ll probably use most frequently is General Issues. This displays your broken links, misspellings, and additional information related to the Quality Assurance score of your site. You’ll want to fix any broken links and misspellings reported here before moving onto other issues.
How to resolve QA issues
There are two common ways that you can select from to start fixing QA issues:
From the Quality Assurance dashboard
If you have a red ring in one of your General Issues widgets, you can click the button below that ring to view more details about those issues. This is the recommended way of viewing most QA issues.
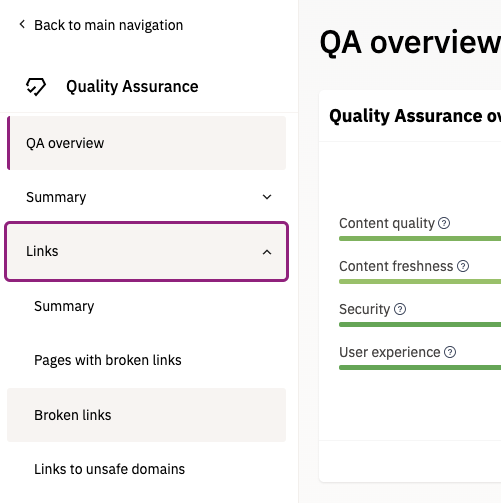
From the site navigation
On the left side rail, you can select Quality Assurance and then choose the category you want to work in.
How do I know when all my QA issues are fixed?
Once you have fixed all the issues within a category, you will see a green smiling face along with a message underneath that says you have 0 issues to resolve. However, further down in the dashboard, you may see that some issues that you fixed are still showing up. For these to clear, so long as they have been fixed, Siteimprove will need to crawl your site again. Site crawls are initiated about every 5 days and can take up to a few hours to complete.
Siteimprove QA Resources
- Guides & FAQs: Quality Assurance
- Creating inclusive content
- Quality Assurance: Broken Links and Misspellings